
11/09/2022 Uptrend under Pressure. Market FALLS HARD across the board
11/09/2022 Uptrend under Pressure. MarketFALLS HARD across the board

THE MARKET’s MESSAGE: Market is back towork after Fed’s rate increase
The Nasdaq usually runs up faster and runs down faster than the S&P500 and DJIA. Look at the three indexes on one chart since the start of 2020 (a month and a half before the Covid-19 panic hit.)
What I find most interesting looking back over the whole pandemic, is how close the major indexes are after all the falling and rising and falling.

But when I think about it, the major indexes are just doing what they always do:
· The Nasdaq always rises and falls faster than the others.
· The DJIA makes its standard more conservative moves.
· The S&P500 is in-between.
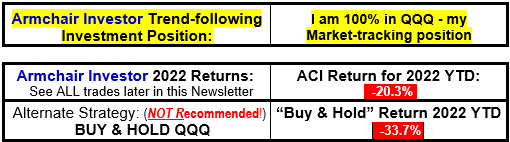
But if you were in the Nasdaq during the big rise off the March 2020 low, you made a much higher return than the other two indexes. And if you followed this newsletter’s guidance during the downtrending market this year, you are not down as much as a common “buy and old”strategy. …..
Opps! I made a typo there--- I meant “buy and HOLD” strategy. But I laughed at the mistake and decided to include it here for your amusement... and education. In fact…… you are invited to use the “buy and old” phrase when talking to your investor friends who still believe in the “buy-and-hold” strategy. Say it enough times and you may get them re-thinking the strategy.
BACK TO THE INDEX COMPARISON CHART – The bottomline is that, “Yes, A “buy and hold” strategy is commonly recommended by financial advisors who don’t have a clue about the strength of the current market. But you are not stuck with this out-of-date strategy.
>>>>>Bottom line: You are much more likely to earn a stronger return by following this newsletter’s insights. >>>> No round-tripping for us!

Remember:
The market continues in the direction it is going (downtrend) …..
until it doesn’t.
And NO ONE knows how longthat will be.
If your portfolio includes individual stocks and they are holding up, you may decide to continue to hold them even in this overall falling market. Please don’t fall in love with any of your stocks and hold them through deep drops.
Wishing you, “Many Happy Returns!”
Charlotte Hudgin, The Armchair Investor, (214) 995-6702
===============
Look at the MARKET FACTORS table below. Note the number of Accumulation days versus Distribution days! That's 9 winners (accumulation days) versus only 2 losers (distribution days) in the last 20 trading days. I'll take that ratio any time!

Notes: On the following MARKET ACTION chart, look at 10/25. The Nasdaq hit a new high price in the last 20 trading days.
Note: If the price orfindex moves less than +/-0.2%, the day is not showing enough of a price orvolume move to be significant. Just think of it as a “sleeping” day!

Here’s some encouraging news. Lookat the table below – Note the percentage of "A" and "B" stocks continues to grow - from 25% to 45% over just the last 4 weeks!

The ArmchairInvestor newsletter is protected by US copyright laws. You are welcome to copy pieces of thenewsletter and share them with friends as long as you attribute those pieces to www.ArmchairInvestor.com Thank you.
CharlotteHudgin, Editor
More Recent Posts
2024-02-15H: Nasdaq and S&P500 RISE Thursday but LOWER VOLUME resulted in No Accumulation day today!
Armchair Investor: 1/2/2024T After Monday's MAJOR +2.2% ACCUMULATION DAY, the market Held its Ground