
3/20/2023 It is not uncommon that the market gets quiet a day or two before the Federal Reserve’s meetings.
It is not uncommon that the market gets quiet a day or two before the Federal Reserve’s meetings to decide on changes to the Fed Fund rate.

THE MARKET’S MESSAGE: Market says, ”If the banks start failing, the future looks dangerous!”

Monday was an unusual day in the performance of the leading indexes. The Nasdaq usually out-performs the S&P500 and the DJIA whether the market is rising or falling. But the Nasdaq was the slow pony Monday, up only 0.4% rise while theS&P500 rose 0.9% and the winner of the day was the DJIA rising 1.2%. Good show guys!
As Investors.com said in today’s Big Picture column, “One reason for the divergence is pretty clear: The Nasdaq has only 4% exposure to financials, compared with 13% for the S&P 500. Financials are the Dow's largest sector, a 20% weighting.

But don’t worry.I don’t see a shift in how these three play together long-term. Occasionally individual news will create an unusual result but it does not mean that the DJIA is taking the long-term lead.
>>>>The Federal Reserve will meet Tuesday and Wednesday and will decide what to do with the Fed Funds rate. It is not uncommon that the market gets quiet a day or two before their meetings to decide on changes to the Fed Fund rate. STAY TUNED!
We are almost through the first quarter of 2023 and I am certainly glad I put my market-following funds in the Nasdaq100 (the QQQ). Here are the results for the 3 major indexes and the QQQ since you cannot buy the full Nasdaq as a single purchase.)

From the weekend ACI newsletter (in case you missed it.)
Wow! Did Friday’s huge volume scare you? The high volume was NOT a surprise. It’s not that the day dropped so much, but the extraordinary volume that was a concern… until you realized that Friday was a “quadruple-witching”day when “index futures, stock futures, index options and stock options expire simultaneously.”(Investopedia.com)
I recommend you mark in your investing calendar for future third Fridays of the last month each quarter (in March, June, September and December.) Note that you should expect high volume on those days as a high number of options and futures contract expire on those days.
The key to seeing what the market said to us on Friday is to look at what happened to the major indexes. If you didn’t look at the volume, Friday would like a disappointing day – but no one is jumping out of windows.
All the professional traders know these quarterly events happen. When options and futures expire “in the money,” their trades are executed. When the are worthless, they are left to expire.
=================================================================================================


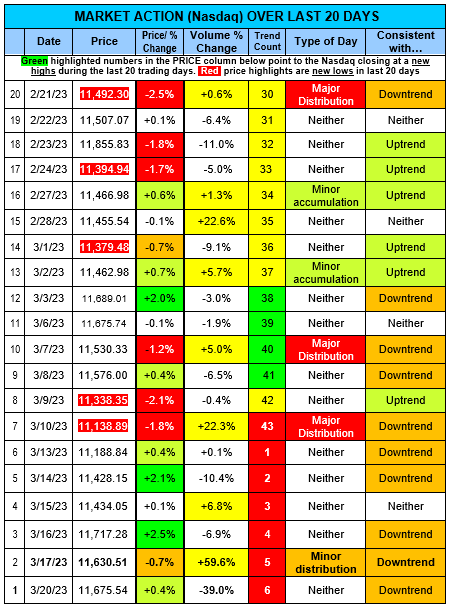
Refer to the next table, MARKET ACTION (Nasdaq) OVER LAST 20 DAYS
Why is the market diagnosis still DOWNTREND when the market rose 4 of the last 5 days? The answer is VOLUME! In fact, in the last 11trading days, only one day had price and volume that was “consistent” with an Uptrend.
Look at the rightmost column. In the last 11 days ….. there were 8 days “consistent with” a Downtrend but only 1 day was “consistent with” an Uptrend. YES, there were 5 days of those 11 days I am talking about that had rising prices.
But how many of those rising days had higher volume? (look for yellow volume days.)
NOT A ONE!…. None…. Zero…..Zip..
That tells you the market was not really interested in adding to their portfolios during the last week.
On the MARKET FACTORS, COUNTS & RATINGS table below, there are only 2 GREEN ”Type of Day” boxes. (rightmost column) of UPTREND and the Nasdaq’s A” Accumulation rating and Nasdaq is the only index above its 50-day moving average line (by at least 2%).

>>>>> When you look at the last 4 weeks of the ACCUMULATION/DISTRIBUTION RATINGS table BELOW, what do you see happening to the number of “A” and “B” rated stocks? (the stocks that are being bought.)
>>>> Look at the rightmost column labeled “As + Bs.”
The rising stocks (with A orB ratings) continue to disappear, dropping from an exciting 59% to a mediocre 29% on Monday.
>>>> That drop points at a lot of selling of the best rated stocks over the last month.
The four weeks of disappearance of the top rated stocks would only happen if the institutional investors wanted to slip out with recent profits in hand.
Why would the professional investors sell off their best stocks so consistently? It is likely they see bad news coming.
ACCUMULATION/DISTRIBUTION RATINGS of STOCKS

Are you holding onto stocks that you like in spite of their weak chart action? Not me! Cash is always a safe alternative. But note this recent broad rotation (past highly rated stocks being sold and underrated stocks being bought,)
>>>>>>>>>>>>> PLEASE READ THE FOLLOWING NOTE >>>>>
NOTE: A long time ago, (after paying for this lesson multiple times…..) I finally learned two important lessons:
1. I am NOT smarter than the market. And,
2. The market does not care about my “fine”opinion.
When I see the institutional investors selling hard (as shown by the drop of ”A” and “B” rated stocks, I am happy to step out of the market by selling my QQQ position.
NOTE: If you have individual stocks or ETFs that are holding up well, you certainly can hold them. But please keep a tight rein on them.
Remember: Stocks usually fall faster than they rise!
==================

Wishing you, “Many Happy Returns.”
Charlotte Hudgin, The Armchair Investor, (214)995-6702
www.ArmchairInvestor.com (214)995-6702
More Recent Posts
2024-02-15H: Nasdaq and S&P500 RISE Thursday but LOWER VOLUME resulted in No Accumulation day today!
Armchair Investor: 1/2/2024T After Monday's MAJOR +2.2% ACCUMULATION DAY, the market Held its Ground